


-
 1 of 2
Re-imagining the office - Workplace Strategy and Design
Companies in the Middle East and around the world are questioning the purpose of physical office space and are having to ‘reimagine’ the future of work. -
 2 of 2
Reimagining the workplace - Flexible office space
Flexible space will take a different form than it has in the past, but will continue to grow as corporates and investors respond to the increasing demand for flexibility brought on by COVID-19.
Global Real Estate Transparency Index 2020
The index ranks 99 countries and territories and 163 cities globally. It is an essential guide for companies operating in foreign markets and a unique benchmark of real estate market transparency.
-
 1 of 4
MENA Construction Market Intelligence Update H1 2023
UAE, Saudi Arabia, and Egypt account for 60% of MENA’s $3 trillion construction project pipeline
-
 2 of 4
Why Riyadh needs a significant increase in multifamily housing over the next 10 years
Insight by James Lynn, Director of Strategic Consulting – KSA -
 3 of 4
Sustainability Magazine 2021
Read our new magazine to learn more about how to accelerate your business's journey to becoming more sustainable, more resilient, and more responsible. -
 4 of 4
JLL named one of Ethisphere’s 2021 World’s Most Ethical Companies for 14th consecutive year
Recognizes commitment to integrity and values-based leadership
Your needs
Find & lease space
Move into your first office, find a new one with room to grow, or develop a complete location strategy.
Manage property & portfolio
Demand more from your real estate. Go beyond cost and risk mitigation.
Design & deliver projects
Breathe life into old space, or create something brand new to help your people thrive.
Invest in real estate
Uncover investment opportunities and capital sources – all over the world.
Transform with technology
Take your business beyond its existing limits. Implement tools, processes, and strategies that improve the value and performance of your real estate.
Trends & insights


How sports venues keep the lights on after game day

Breathing new life into Africa’s hotels: trends, transformations and role of project management

Morocco's Education Real Estate: Thriving Opportunities in a Center of Academic Excellence


Client stories
Arden Group secures an $800 million seed investment to expand portfolio
Arden Group, a real estate investment and management firm, had its eyes set on expanding its sizeable portfolio into new markets.

Creating London’s first new district for over 50 years
British Land pioneers mixed use regeneration of Canada Water with support from JLL.
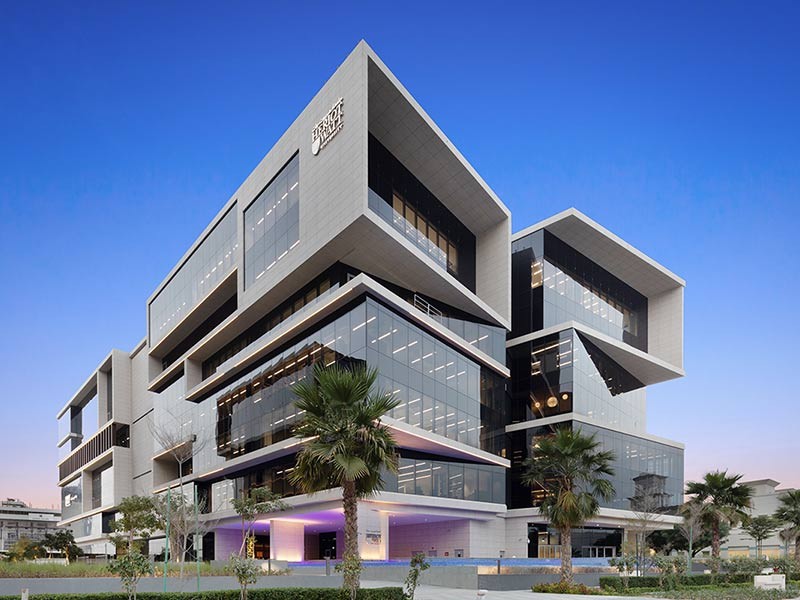
A university that is leading the way, creates a campus to match
JLL's integrated team supported Heriot-Watt University Dubai throughout the project, from its initial stages to its successful completion.
Latest news

Corporate real estate disposals show resilience despite market uncertainty
JLL’s 2024 Raising Capital from Corporate Real Estate report shows modest weakening for corporate disposals in 2023, with stronger market activity anticipated for the year ahead
Rethinking the innovation hub model for financial services firms
Tailored workplace and real estate strategies will help strengthen the industry that is being transformed by technology
JLL secures +50% LTV financing for Limestone Capital's Madrid hotel acquisition
JLL advised Limestone Capital on securing financing for the acquisition and rebranding of a prime central Madrid hotel located on C. de Atocha, 49, Centro, 28012 Madrid, Spain
Europe needs 3.6 million private rental homes over next decade
Institutions primed for potential €1.4trillion investment opportunity.
SEE A BRIGHTER WAY
We want the most ambitious clients to work with us, and the most ambitious people to work for us. So, if you want a career in real estate, supported by amazing people and working with brilliant clients all over the world, get in touch.